I love organizing information. Multiple variables. Relationships between items. Organized data can be visualized through graphic design, and for a long time I've thought about tackling the seasonality of produce.
I'm kinda obsessed with how we've industrialized away the realities of nature in the name of convenience. In the face of climate catastrophe, we'd do well to reassess the comforts we expect, which often has other consequences beyond pollution. One of those comforts is the universal availability of all produce.
When you eat produce in season, it's grown closer to home, supporting your local farmers and reducing the carbon footprint of transportation. That shorter farm-to-table time means fresher, tastier food, and studies show it's more nutritious. Today I'm sharing a quick graphic design study seeking to colorfully represent iconic seasonal produce.
The Design
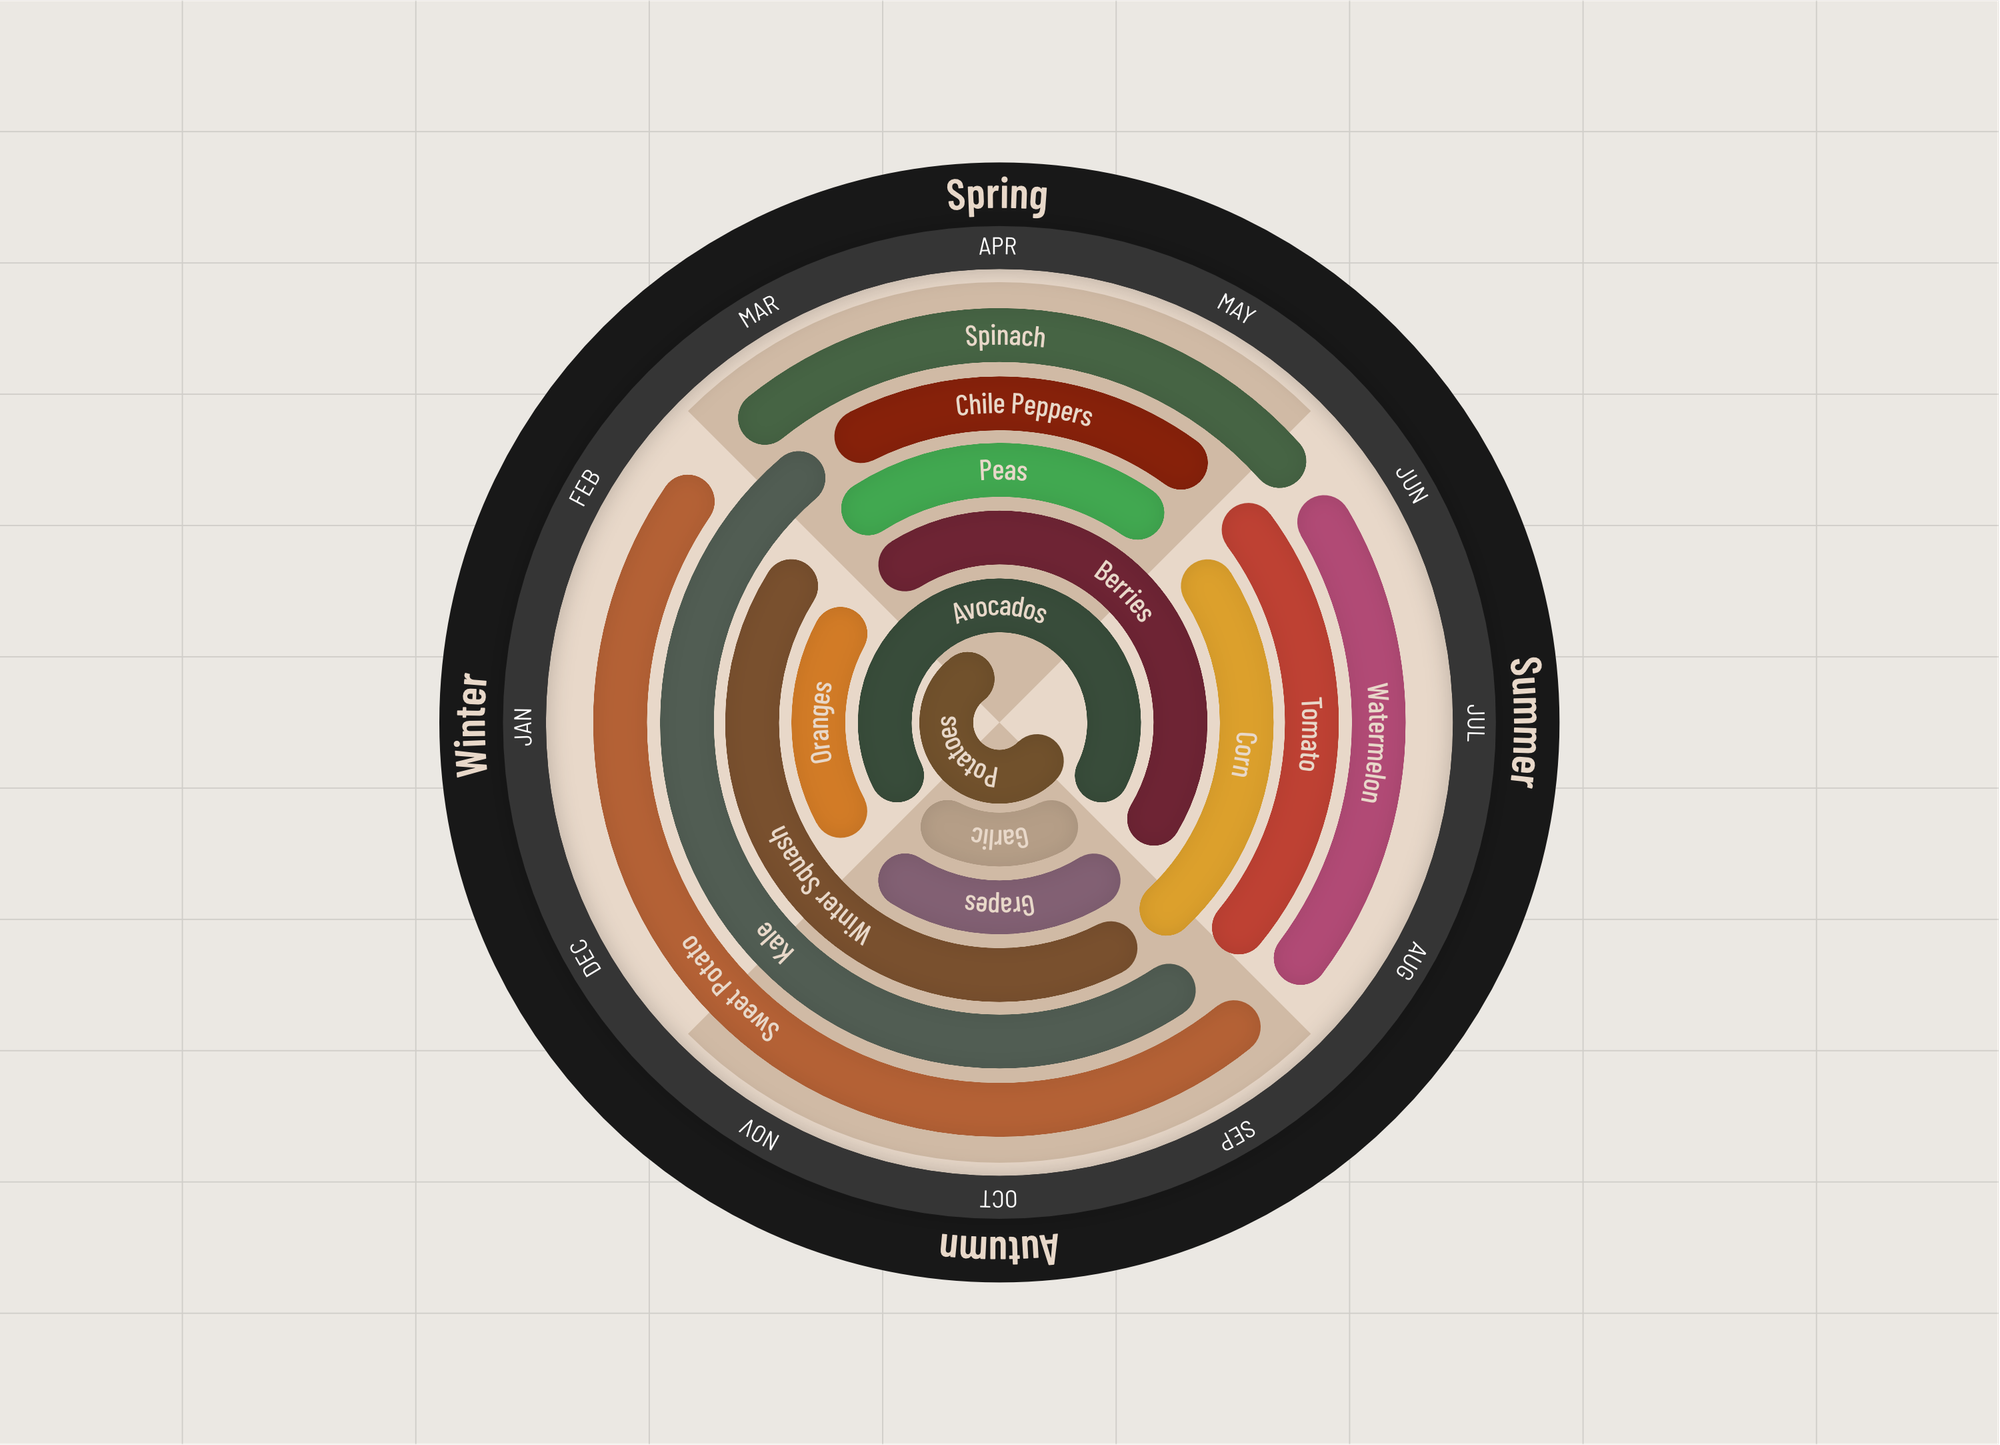
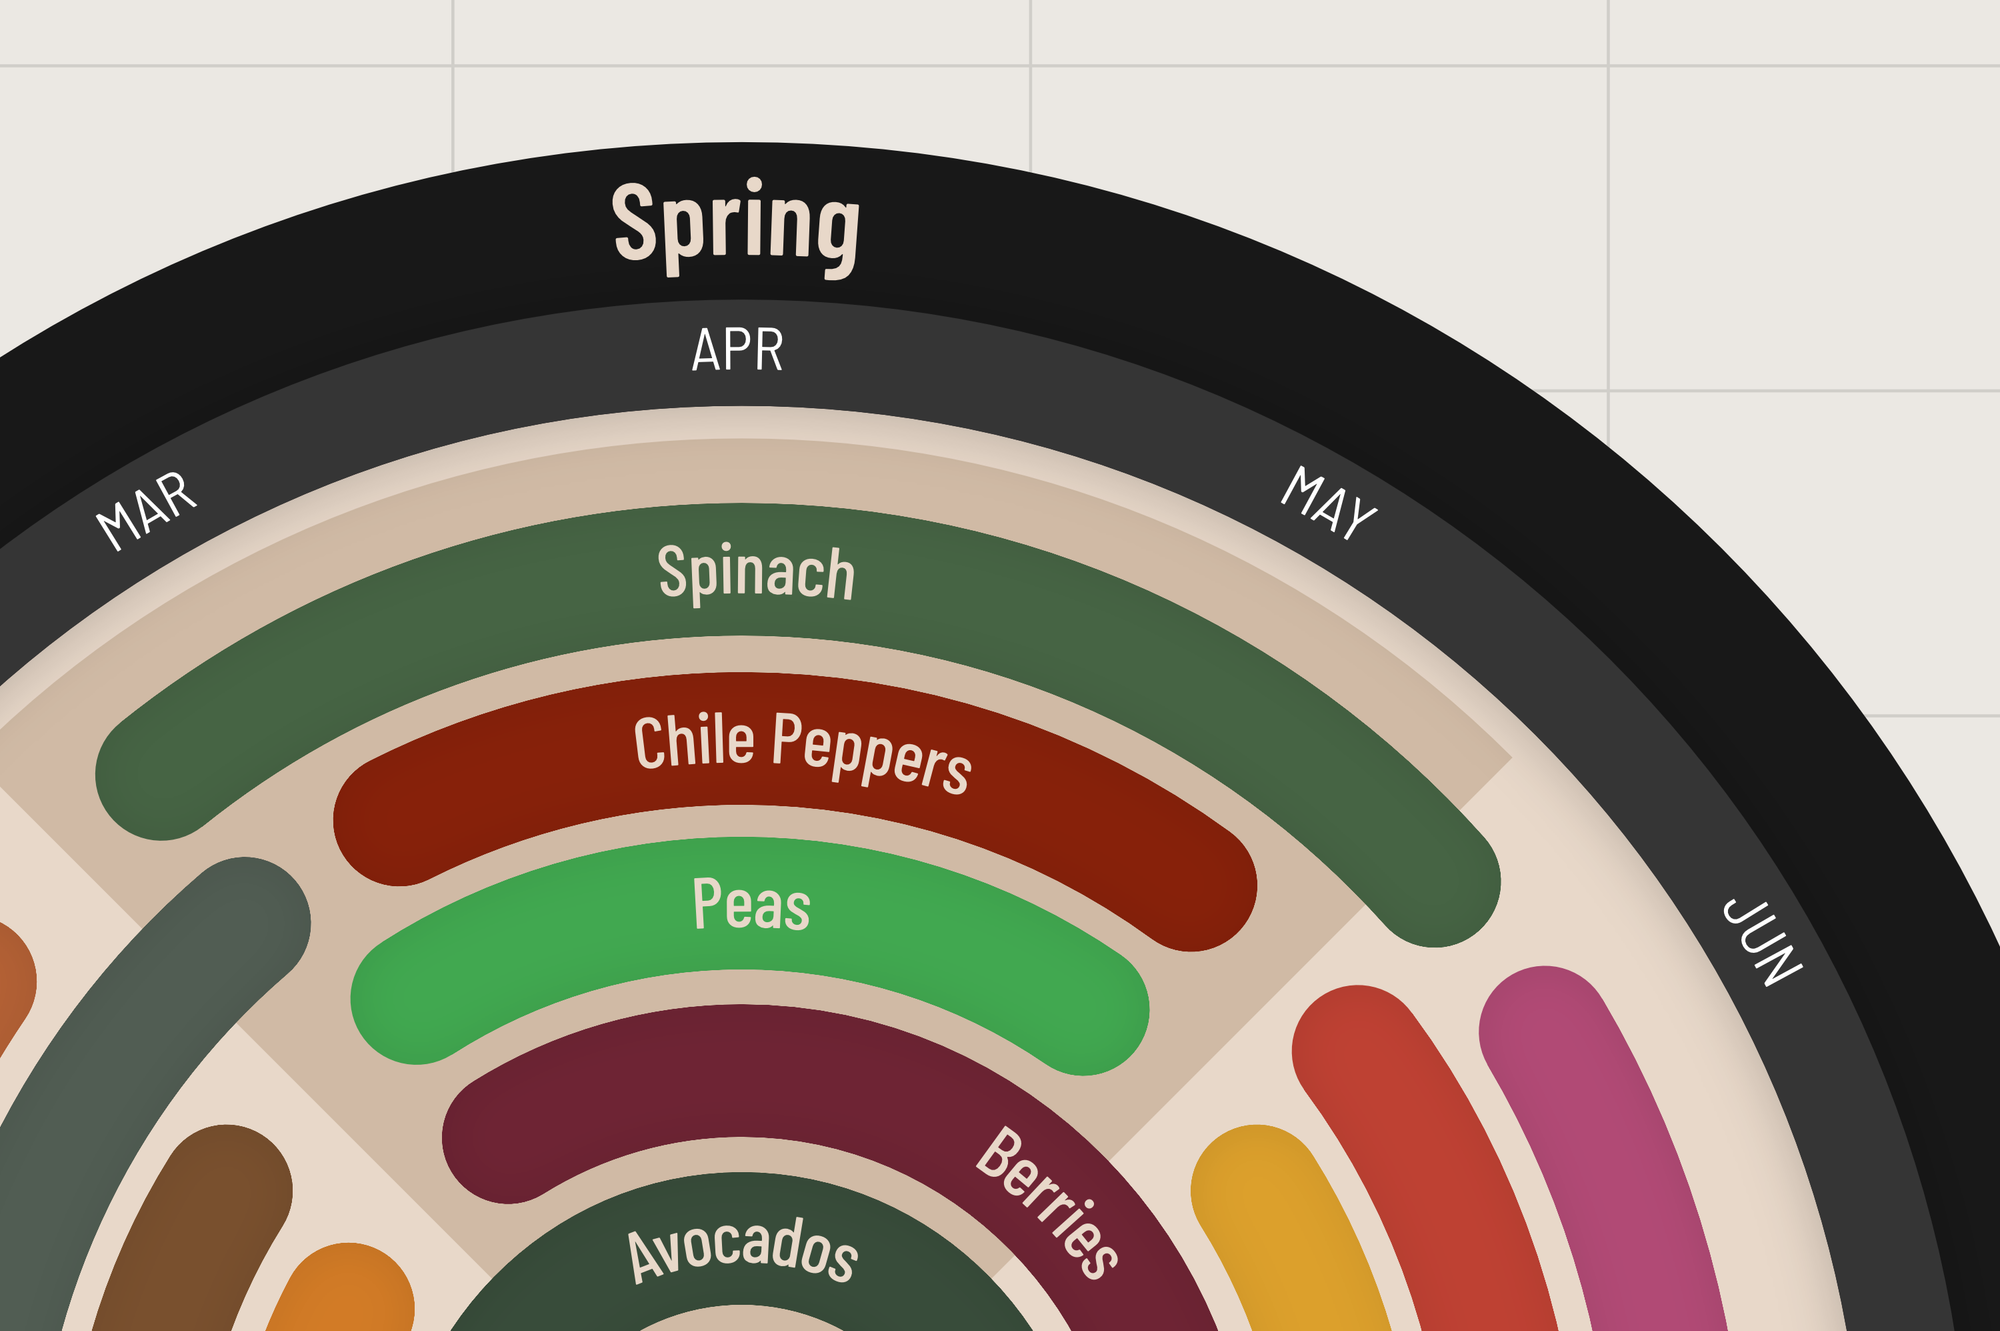
Here's what I came up with. The outermost ring displays the season, followed by the month. Produce is represented in these color-coded ring segments that span the duration. There's an alternating wedge in the background to help visually separate the seasons.

Now that I've ditched Adobe Illustrator, I created this in the far superior Affinity Designer, which has an excellent pie tool that allows me to live adjust the endpoints of the ring segments.

Spinning Cover
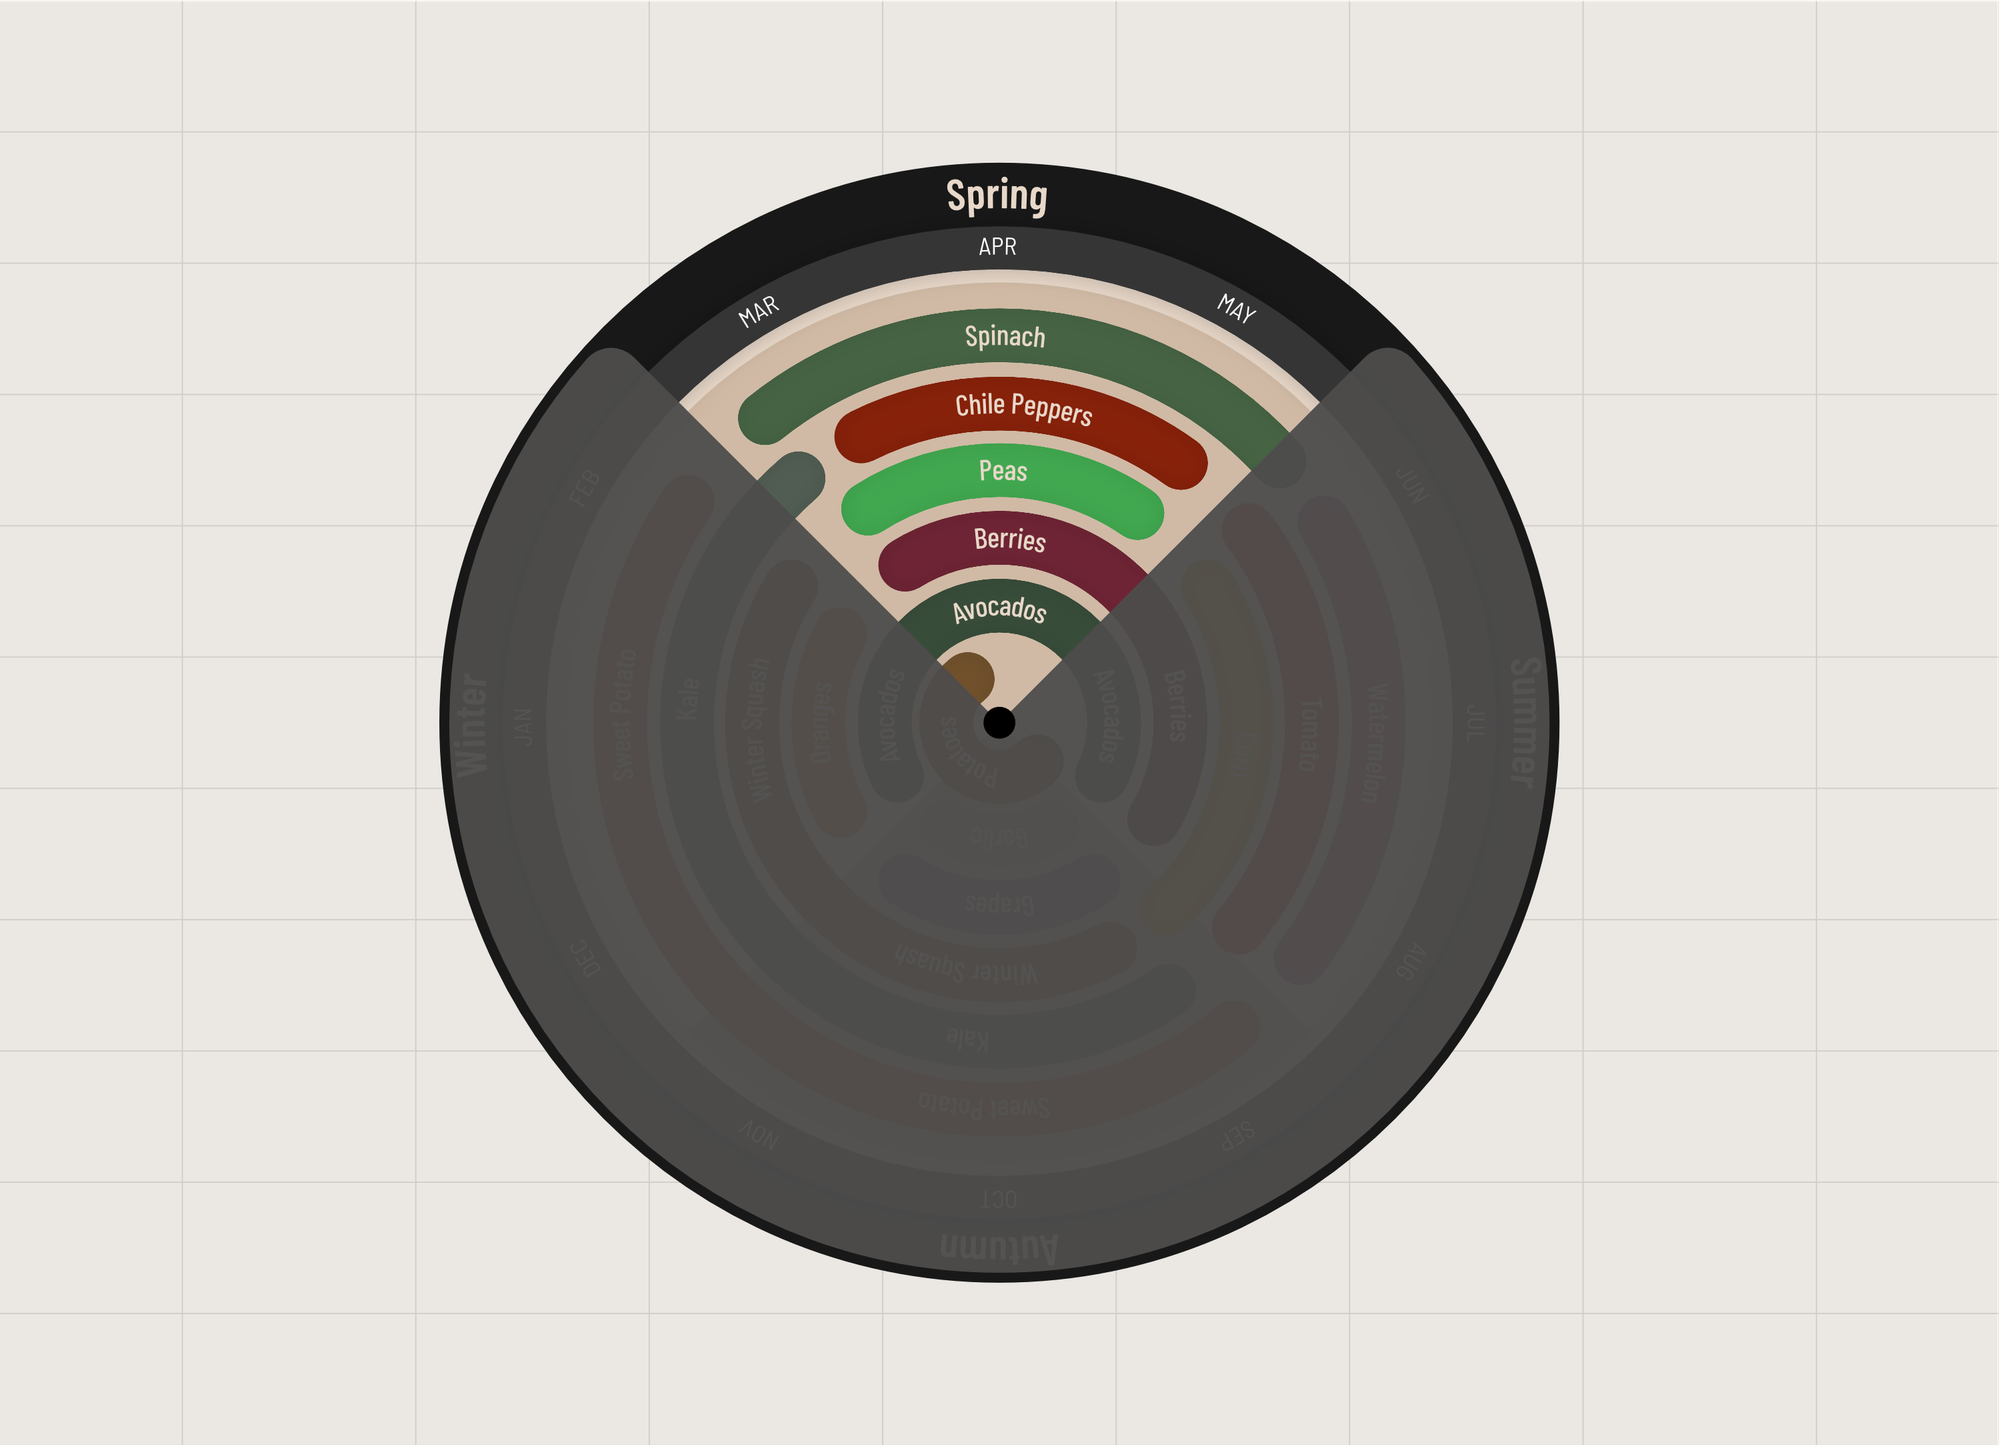
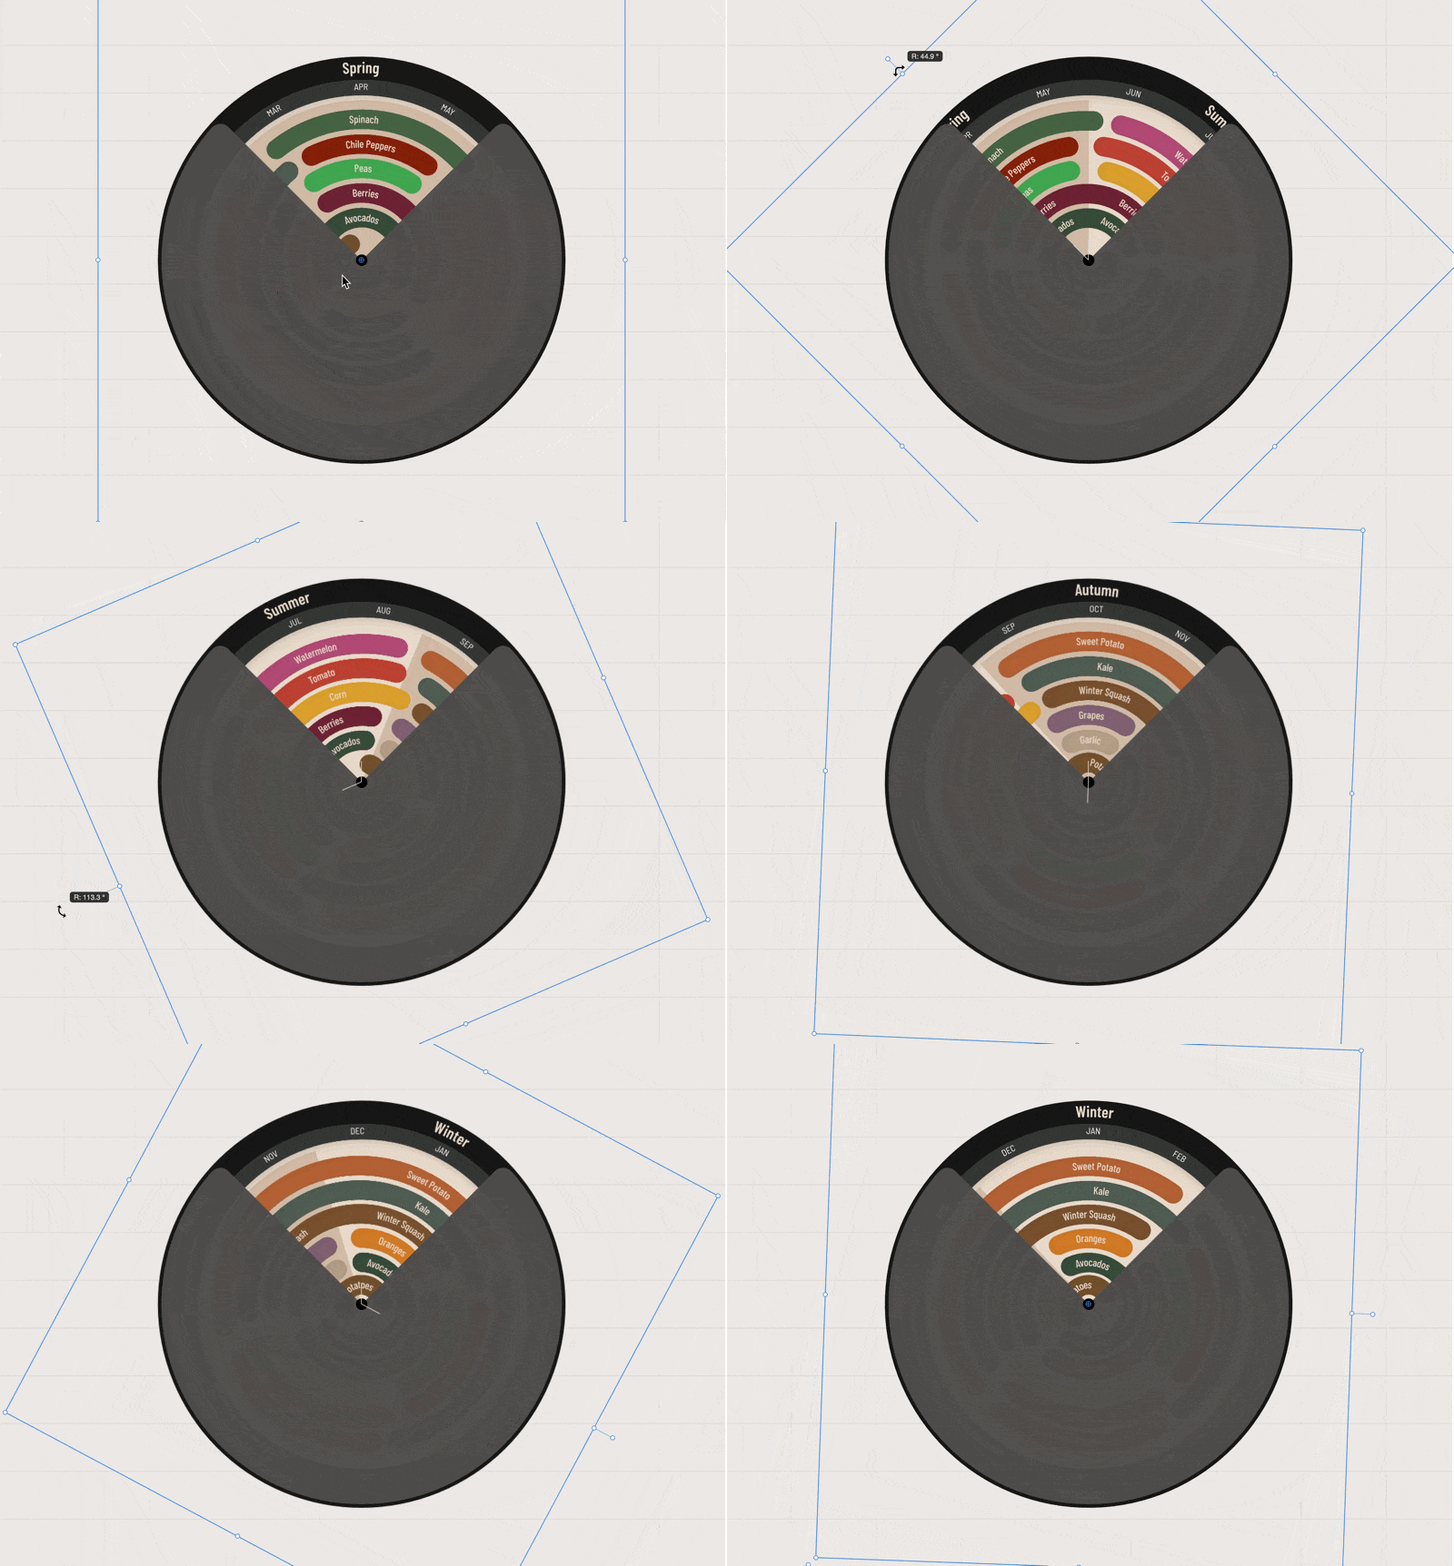
The obvious benefit of this wheel design is how you can spin its orientation for the current month of the year. It could be printed with a center-pinned cover could partially obscure the other seasons. On this variation, I repeat the food names multiple times so they're visible in every season they span.

And here's what the wheel would look like moving.

Resources
There's lots of resources out there today for seeing what plants are in season. They're just not as stylish.
- I based my design on this general chart from US Foods
- Because seasonality is dependent on where you live and the weather, this tool gets more granular.
- If you want to learn more about how nutrition relates to seasonal produce, here's an article from Healthline, which has been medically reviewed.
- The USDA has this tool to help you find farmers' markets and other local food hubs.
Future Projects
I'd still position this as a concept. It should be an accurate enough reference if you do want to save it, but it needs more refinement before I'd print it. Maybe more personality too. I could revisit the design someday, but maybe it's a concept that gets rolled into a future wall calendar. Let me know what you think, and check out those other resources to get started with seasonal eating.


